
Better Temp Coefficient or Cooler City? What Moves Hot-Climate Yield
On an 8 kW Shiraz run, a −0.29%/°C TOPCon coeff beats −0.34%/°C PERC by ~146 kWh/year. Moving the same PERC to cooler Isfahan gains ~278 kWh.
Method note
Modeled 8 kW south-facing fixed arrays at Shiraz (29.6106°N, 52.5245°E) and Isfahan (32.6539°N, 51.6660°E). Weather is JRC PVGIS TMY (API v5_2), run 2026-07-26. Hourly AC uses pvlib 0.11.2 (PVWatts DC + Faiman cell temperature + PVWatts inverter), tilt 29°, azimuth 180°, 14% system loss. Module Pmax temperature coefficients come from Canadian Solar datasheets: HiKu6 CS6W-MS mono PERC at −0.34%/°C and TOPHiKu6 CS6.1-54TM-H n-type TOPCon at −0.29%/°C. Nameplate kW is held constant so only γPmax (and city weather) change. Background: temperature coefficient and peak sun hours.
Direct answer
On Shiraz, swapping PERC (−0.34%/°C) for TOPCon (−0.29%/°C) lifts annual AC from 13,665 kWh to 13,811 kWh (+146 kWh, about +1.1%). Moving the same PERC array to Isfahan instead yields 13,943 kWh (+278 kWh, about +2.0% vs Shiraz PERC). So the datasheet coefficient step is real and worth checking, but a cooler nearby climate with similar plane-of-array irradiance moved yearly energy more than that 0.05 percentage-point coefficient gap in this pair. Peak sun hours alone would have pointed the wrong way: Shiraz’s average daily GHI/1000 is 5.68 vs Isfahan 5.59, yet Isfahan still wins on AC.
Hypothesis
A datasheet step from −0.34%/°C to −0.29%/°C is a meaningful hot-climate lever, but a nearby cooler city with similar plane-of-array irradiance can change annual AC by as much as, or more than, that coefficient step alone.
Inputs
| Input | Value | Source | Your site may differ |
|---|---|---|---|
| Primary site | Shiraz 29.6106, 52.5245 | Chosen hot-plateau coordinate | Dust, shade, roof height |
| Compare site | Isfahan 32.6539, 51.6660 | Nearby hot-climate contrast | Microclimate |
| Array | 8 kW DC, tilt 29°, south, 14% loss | Fixed across scenarios | Match your roof |
| PERC γPmax | −0.34%/°C | Canadian Solar HiKu6 CS6W-MS datasheet | Check your PDF |
| TOPCon γPmax | −0.29%/°C | Canadian Solar TOPHiKu6 CS6.1-54TM-H datasheet | Check your PDF |
| Mid sensitivity | −0.32%/°C | Stated midpoint (not a product) | Quote real modules |
| Weather | PVGIS TMY v5_2 | JRC API 2026-07-26 | Interannual weather |
| Model | pvlib PVWatts + Faiman | pvlib 0.11.2 | Mounting airflow |
Climate and irradiance box
| Metric | Shiraz | Isfahan |
|---|---|---|
| Avg daily GHI / 1000 (PSH proxy) | 5.684 | 5.594 |
| Annual GHI (kWh/m²) | 2,075 | 2,042 |
| Annual POA at tilt 29° (kWh/m²) | 2,224 | 2,246 |
| Mean air temp (°C) | 18.5 | 16.5 |
| Mean daylight cell temp, Faiman (°C) | 39.4 | 36.9 |
Shiraz has slightly more horizontal irradiance. Isfahan has slightly more plane-of-array energy at this shared tilt and runs cooler cells. That combination explains why “more sun on the map” is not the same as “more AC on the meter.”
Scenario results (annual AC)
| Scenario | γPmax | Location | Annual AC (kWh) | Δ vs Shiraz PERC |
|---|---|---|---|---|
| A PERC baseline | −0.34%/°C | Shiraz | 13,665 | baseline |
| B TOPCon | −0.29%/°C | Shiraz | 13,811 | +146 |
| C Mid sensitivity | −0.32%/°C | Shiraz | 13,723 | +59 |
| D Same PERC, other city | −0.34%/°C | Isfahan | 13,943 | +278 |
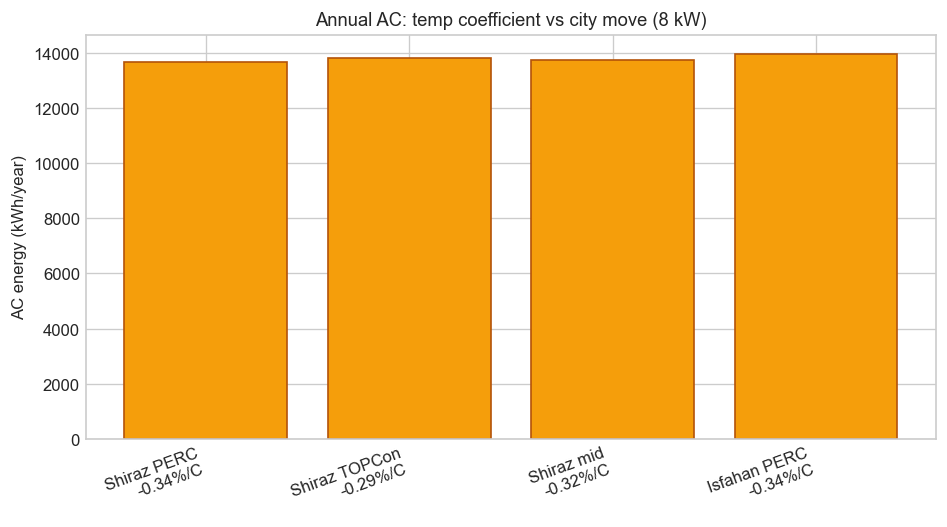
Figure: annual AC for the four modeled scenarios (pvlib hourly, 2026-07-26 run).
Where the coefficient shows up in the year
The TOPCon advantage on Shiraz is small in winter and larger in hot months (July about +23 kWh, August about +21 kWh). That matches the physics: cell temperature rises with irradiance, so γPmax bites hardest when roofs are hottest.
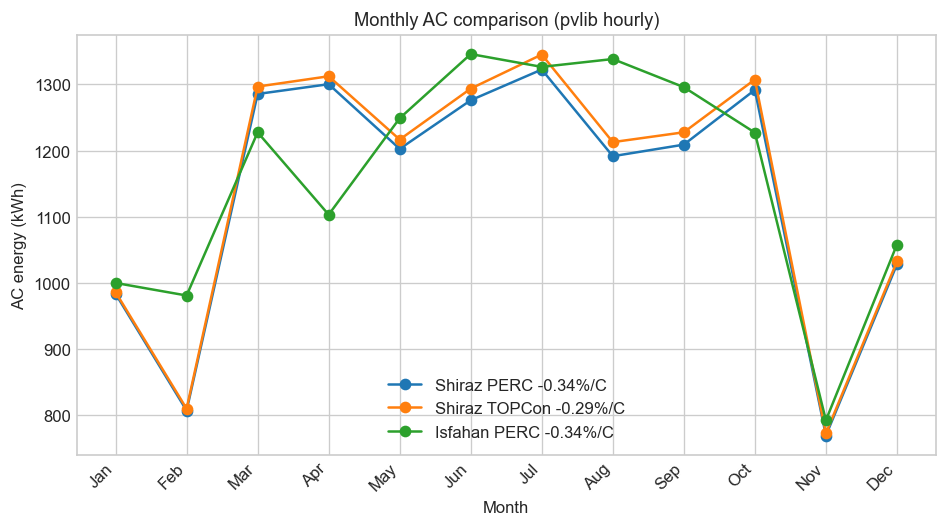
Figure: monthly AC shape for Shiraz PERC, Shiraz TOPCon, and Isfahan PERC.
What this means
Hot-climate buyers often chase peak sun hours or STC watts. This run separates two levers that proposals mix together: (1) the module’s Pmax temperature coefficient, and (2) the site’s thermal and plane-of-array climate. A 0.05 percentage-point better coefficient recovered about 1% annual energy on Shiraz. The Isfahan move recovered about 2% with the same PERC datasheet, even though its GHI-based PSH proxy was slightly lower. Principle: compare modules on the same weather file, and compare sites with production models, not GHI rank alone. See also what affects solar production and n-type cells.
Uncertainty and limits
- TMY is a typical year, not a forecast. Interannual weather can move annual yield by several percent. - Faiman cell temperature is a model, not a rooftop thermocouple. Flush mounts with poor rear airflow run hotter than open racks. - Both cities use the same 29° tilt for a fair coefficient test; a site-optimal tilt per city would change POA slightly. - Only γPmax changes between PERC and TOPCon here. Real modules also differ in NMOT, efficiency, bifaciality, and degradation. - No soiling, shade, or clipping sweep in this study.
What to do with this
1. Read γPmax on every shortlisted datasheet (and keep the PDF). 2. Ask for an hourly production run on your coordinate, not only a PSH table. 3. When comparing two cities or two roofs, hold module assumptions fixed, then swap modules on one weather file. 4. Treat a ~1% coefficient lift as real but easy to lose to shade, soiling, or a hotter microclimate.
Closing
For this Shiraz hourly climate, moving from −0.34%/°C to −0.29%/°C adds about 146 kWh/year on 8 kW. Relocating the same PERC assumptions to cooler Isfahan adds about 278 kWh/year, even with a slightly lower GHI-based PSH proxy. Coefficient shopping helps; climate physics still sets the stage.
Frequently asked questions
- Is a better temperature coefficient worth paying for?
- On this Shiraz run it added about 1.1% annual energy versus a −0.34%/°C PERC baseline. Worth comparing on quotes, but shade, soiling, and microclimate can erase a 1% gain.
- Why did Isfahan beat Shiraz if Shiraz has higher peak sun hours?
- The PSH proxy used average daily GHI. At the shared 29° tilt, Isfahan had slightly higher plane-of-array irradiance and cooler daylight cell temperatures, so annual AC rose.
- Did you change module efficiency as well as the temperature coefficient?
- No. Nameplate kW, tilt, losses, and inverter assumptions stayed fixed. Only γPmax (and city weather in the Isfahan case) changed.
- Which datasheets did you use?
- Canadian Solar HiKu6 CS6W-MS for −0.34%/°C PERC and TOPHiKu6 CS6.1-54TM-H for −0.29%/°C TOPCon, accessed 2026-07-26.
Sources
- PVGIS photovoltaic geographical information system (European Commission JRC)Accessed Jul 26, 2026
- pvlib python v0.11.2 hourly PVWatts + Faiman model (pvlib community)Accessed Jul 26, 2026
- Canadian Solar HiKu6 CS6W-MS datasheet (Pmax −0.34%/°C) (Canadian Solar / CSI Solar)Accessed Jul 26, 2026
- Canadian Solar TOPHiKu6 CS6.1-54TM-H datasheet (Pmax −0.29%/°C) (Canadian Solar / CSI Solar)Accessed Jul 26, 2026
Related articles
- Hot Panels Make Less Power: The Temperature Coefficient
Solar modules are rated at 25 degrees C, but real cells run much hotter in sun. The temperature coefficient quantifies power loss per degree above STC.
- Peak Sun Hours: The Number That Sizes Your System
Peak sun hours translate daily sunlight into a simple number installers use for production estimates. Learn how to read them and what they do not tell you.
- What Really Cuts Solar Production (From Weather to Wiring)
Daily and annual solar output depends on irradiance, shade, temperature, tilt, equipment health, and system losses. Monitoring helps separate normal variation from faults.
- N-Type Solar Cells: Why the Industry Left P-Type Behind
N-type silicon cells use phosphorus doping and resist light-induced degradation better than conventional p-type PERC. TOPCon and HJT builds on n-type wafers dominate next-gen modules.
- Mono vs Poly Solar Panels: What Still Matters
Mono and poly modules differ in crystal structure, efficiency, appearance, and temperature behavior. Modern mono dominates new installs, but poly still appears in budget lines.
- How Much Extra Power Do Bifacial Panels Really Add?
Tilt and roof orientation can move bifacial gain more than shoppers expect. See the Tehran 8 kW rundown.
- Solar Panels Explained: What to Compare Before You Buy
Cell types, efficiency ratings, degradation, temperature behavior, production drivers, warranties, and module lifecycle explained for homeowners comparing panel options.
- Solar Proposal Checklist: What a Real Quote Must Show
A low headline price means little without a documented production model, equipment list, warranty terms, and interconnection scope. Here is what to check before you sign.