
Battery or More Panels? What Actually Raises Self-Consumption
When export credit is weak, a 10 kWh LFP pack can lift on-site kWh far more than upsizing from 8 to 10 kW.
Method note
Worked example for an 8 kW south-facing rooftop at Tehran coordinates (35.6892°N, 51.3890°E). Monthly AC production comes from a JRC PVGIS PVcalc run dated 2026-07-23 (8 kWp and 10 kWp, tilt 33°, south, 14% system loss). An independent hourly pvlib 0.11.2 cross-check on PVGIS TMY for the same 8 kW setup (run 2026-07-23) yields about 12,639 kWh/year, within about 2% of the PVGIS PVcalc annual total used in the tables below. Self-sufficiency rates without and with storage follow published residential ranges from IEA PVPS Task 12 LCA work and related self-consumption literature (about 30–37% SSR without a battery; higher with 5–10 kWh storage). Annual household use is a stated 5,400 kWh design load with a mild summer peak. Export credit is a labeled variable (`export_weight`), not a utility promise. Rebuild with your bills before decisions. Method companion: solar ROI payback method.
Direct answer
On this Tehran climate run the 8 kW array yields about 12,876 kWh/year (~1,609 kWh/kW). With a 5,400 kWh home load and ~35% self-sufficiency (no battery), only about 1,890 kWh is used on site and the rest exports. Adding a 10 kWh LFP pack and raising SSR to about 57% (IEA Task 12 scale for a ~10 kWh residential pack) lifts self-consumed energy to about 3,078 kWh (+1,188 kWh). Upsizing the array to 10 kW without storage (~16,095 kWh/year) only nudges self-consumption to about 2,052 kWh (+162 kWh) because midday surplus grows faster than evening load. When export credit is weak (`export_weight` 0.2), the battery scenario also wins on annual benefit index. When export is credited near retail, extra PV wins on index even if self-consumed kWh barely moves. That is the 2026 storage lesson in one table: batteries buy timing, not nameplate watts. Background: self-consumption explained and battery storage guide.
Hypothesis
If an 8 kW south-facing Tehran rooftop serves a 5,400 kWh/year household with evening-heavy use, then a modest LFP pack raises self-consumed kWh more than spending the same design step on extra PV capacity when export credit is low, because storage shifts midday surplus into night hours while upsizing mainly increases export.
Inputs
| Input | Value | Source | Your site may differ |
|---|---|---|---|
| Location | Tehran ~35.6892, 51.3890 | Chosen real coordinate | Dust, shade, roof tilt |
| Array A | 8 kW DC, tilt 33°, south, 14% loss | PVGIS PVcalc 2026-07-23 | Match your roof |
| Array C (upsize) | 10 kW DC, same parameters | PVGIS PVcalc 2026-07-23 | Roof area limit |
| Annual AC (8 / 10 kW) | 12,876 / 16,095 kWh | Same PVGIS runs | Weather year varies |
| Annual consumption | 5,400 kWh | Stated design load | Use 12 months of bills |
| SSR without battery | ~35% of consumption | IEA PVPS / Quoilin-class range (~30–37%) | Occupancy pattern |
| SSR with 5 kWh storage | ~45% | IEA PVPS Task 12 residential scale | Usable kWh ≠ nameplate |
| SSR with 10 kWh storage | ~57% | IEA PVPS Task 12 (~10 kWh case) | Dispatch and DoD |
| Chemistry | LFP residential pack | Design choice; see LFP basics | Cycle life and warranty |
| Export weight | Variable 0.2 / 0.4 / 0.6 / 1.0 | Labeled sensitivity | Confirm with utility |
| Installed cost | Not invented | Quotes only | Itemize PV vs storage |
Monthly production (8 kW, PVGIS)
| Month | AC (kWh) | Visual (≈100 kWh/block) |
|---|---|---|
| January | 895 | █████████ |
| February | 897 | █████████ |
| March | 1,079 | ███████████ |
| April | 1,082 | ███████████ |
| May | 1,160 | ████████████ |
| June | 1,209 | ████████████ |
| July | 1,221 | ████████████ |
| August | 1,282 | █████████████ |
| September | 1,237 | ████████████ |
| October | 1,096 | ███████████ |
| November | 853 | █████████ |
| December | 866 | █████████ |
| Year | 12,877 |
(Month rows round to whole kWh; PVGIS annual total is 12,876 kWh.)
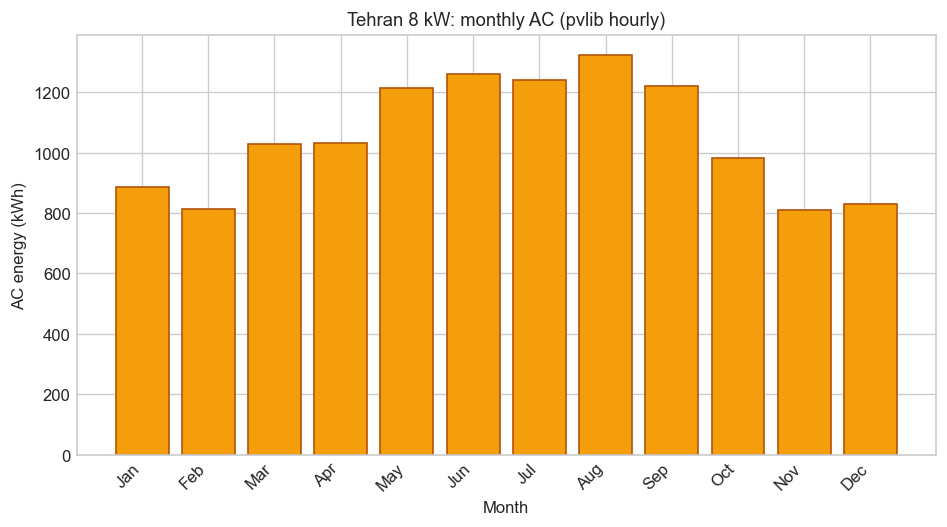
Figure: hourly pvlib monthly shape for the same 8 kW setup (~12,639 kWh/year). The table above stays on PVGIS PVcalc values used in the scenarios.
Monthly energy-match offset (teaching upper bound)
Consumption shape is a stated mild summer peak totaling 5,400 kWh. Production is the 8 kW PVGIS row. Formula: self-consumed = min(production, consumption); exported = max(0, production − consumption); imported = max(0, consumption − production). This monthly energy match ignores hour-level timing, so imports look near zero. Real homes still import after sunset; the SSR scenarios below are the realistic teaching layer.
| Month | Production | Consumption | Self-consumed | Exported | Grid import |
|---|---|---|---|---|---|
| January | 895 | 430 | 430 | 465 | 0 |
| February | 897 | 400 | 400 | 497 | 0 |
| March | 1,079 | 390 | 390 | 689 | 0 |
| April | 1,082 | 380 | 380 | 702 | 0 |
| May | 1,160 | 420 | 420 | 740 | 0 |
| June | 1,209 | 530 | 530 | 679 | 0 |
| July | 1,221 | 590 | 590 | 631 | 0 |
| August | 1,282 | 560 | 560 | 722 | 0 |
| September | 1,237 | 440 | 440 | 797 | 0 |
| October | 1,096 | 400 | 400 | 696 | 0 |
| November | 853 | 410 | 410 | 443 | 0 |
| December | 866 | 450 | 450 | 416 | 0 |
| Year | 12,877 | 5,400 | 5,400 | 7,477 | 0 |
Scenario comparison: self-consumed kWh
| Scenario | PV size | Storage | SSR (of load) | Self-consumed | Exported | Δ SC vs PV-only |
|---|---|---|---|---|---|---|
| A PV-only | 8 kW | none | 35% | 1,890 | 10,986 | baseline |
| B +5 kWh LFP | 8 kW | 5 kWh | 45% | 2,430 | 10,446 | +540 |
| C +10 kWh LFP | 8 kW | 10 kWh | 57% | 3,078 | 9,798 | +1,188 |
| D Upsize PV | 10 kW | none | 38% | 2,052 | 14,043 | +162 |
Self-consumed lift from a 10 kWh pack (+1,188 kWh) dwarfs the lift from +2 kW of PV without storage (+162 kWh). Upsizing still adds ~3,219 kWh of annual production, almost all as export.
Annual benefit index
Index = self-consumed × 1.0 + exported × `export_weight`.
| export_weight | A PV-only 8 kW | C +10 kWh LFP | D 10 kW PV-only | Battery beat upsize? |
|---|---|---|---|---|
| 0.2 (weak export) | 4,087 | 5,038 | 4,861 | Yes (+177 vs D) |
| 0.4 | 6,284 | 6,997 | 7,669 | No |
| 0.6 | 8,482 | 8,957 | 10,478 | No |
| 1.0 (full retail) | 12,876 | 12,876 | 16,095 | No |
| Sensitivity on C (+10 kWh) | Change | Benefit index at weight 0.2 |
|---|---|---|
| Base | As table | 5,038 |
| Conservative production (−10%) | Scale PV year × 0.9; keep SSR | ~4,782 |
| Lower SSR (50% instead of 57%) | Less evening shift | ~4,754 |
| Weight 0.4 instead of 0.2 | Stronger export credit | 6,997 |
Installed cost is omitted as a single currency figure. Compare quotes by asking what you pay per extra self-consumed kWh versus per extra exported kWh. See complete guide to solar ROI and solar proposal checklist.
What to do with these tables
1. Pull 12 months of billed kWh and sketch daytime vs evening share. 2. Run PVGIS or PVWatts for your coordinate; keep the run date. 3. Apply a no-storage SSR near 30–40% unless you have monitored hour data. 4. Size storage from evening deficit, not from total annual export. Hybrid inverters and DC vs AC coupling change how that pack connects. 5. Stress-test `export_weight` before choosing upsize vs storage.
Closing
For this Tehran PVGIS climate and IEA-scale self-sufficiency bands, a 10 kWh LFP pack buys far more on-site kWh than adding 2 kW of PV when the home already exports heavily. Extra modules still win when every exported kWh is worth nearly as much as a self-consumed one. Decide with your tariff in writing, then rebuild the index with your own load shape.
Frequently asked questions
- Does adding panels always beat adding a battery?
- No. Extra PV mainly grows export. A modest LFP pack raises self-consumed kWh much more when evening load is high and export credit is weak.
- Why is the monthly energy-match import column almost zero?
- It compares monthly totals only. Real homes import at night. Use the SSR scenario table for a more realistic on-site share.
- Where do the 35% and 57% self-sufficiency figures come from?
- Published residential ranges: about 30–37% SSR without storage in European statistical studies, and IEA PVPS Task 12 residential PV-battery LCA cases that raise on-site use with 5–10 kWh packs.
- Should I buy 10 kWh of storage for every 8 kW of PV?
- Not as a rule. Size from evening deficit and resilience goals, then check export_weight. Oversizing storage for rare peaks is usually poor value.
Sources
- PVGIS photovoltaic geographical information system (European Commission JRC)Accessed Jul 23, 2026
- pvlib python v0.11.2 hourly PVWatts-style cross-check (Tehran 8 kW) (pvlib community)Accessed Jul 23, 2026
- Environmental Life Cycle Assessment of Residential PV and Battery Storage Systems (IEA PVPS Task 12)Accessed Jul 23, 2026
- Review and Analysis of PV Self-Consumption Policies (IEA PVPS)Accessed Jul 23, 2026
- Quantifying self-consumption linked to solar home battery systems (Applied Energy (Quoilin et al.))Accessed Jul 23, 2026
Related articles
- Self-Consumption: Using Your Solar Before It Leaves Home
Self-consumption is the share of solar kWh you use on site instead of exporting to the grid. Timing of loads and production determines how high that share can go.
- Home Battery Storage: When Solar Alone Isn't Enough
From backup power to energy independence, understand when adding a battery makes practical sense for your home.
- LFP Home Batteries: Safer Chemistry, Longer Cycles
Lithium iron phosphate (LFP) dominates modern home storage for good reason: stable chemistry, long cycle life, and strong safety profile.
- Hybrid Inverters: Solar, Battery, and Grid in One Box
Hybrid inverters combine PV conversion with battery charging and backup power paths. They simplify storage-ready solar but require upfront planning.
- DC or AC Battery Coupling? The Architecture Trade-Off
DC-coupled batteries charge directly from the PV DC bus through a hybrid inverter. AC-coupled systems use a separate battery inverter on the AC side. Each path has efficiency and retrofit implications.
- Why Solar kWh and Your Utility Bill Don't Match
NREL field data plus a Vermont PVGIS run: why annual kWh balance still diverges from the utility bill.
- How Much Extra Power Do Bifacial Panels Really Add?
Tilt and roof orientation can move bifacial gain more than shoppers expect. See the Tehran 8 kW rundown.
- What an 8 kW Rooftop Can Produce in a Year
A clear yearly production and payback walkthrough for an 8 kW rooftop, built for teaching the method.
- Solar ROI and Bills: How to Read the Real Payback
Read your electricity bill, compare net metering and self-consumption, cut load before sizing solar, estimate payback in Iran, review proposals, and manage peak demand.
- Solar Payback Math for Iranian Homeowners
There is no single national payback number for solar in Iran. Here is the calculation method, built from your own bills and production estimate, that you can use with any price or tariff you confirm locally.
- Solar Proposal Checklist: What a Real Quote Must Show
A low headline price means little without a documented production model, equipment list, warranty terms, and interconnection scope. Here is what to check before you sign.